Trend Breadth
Trend Breadth Count
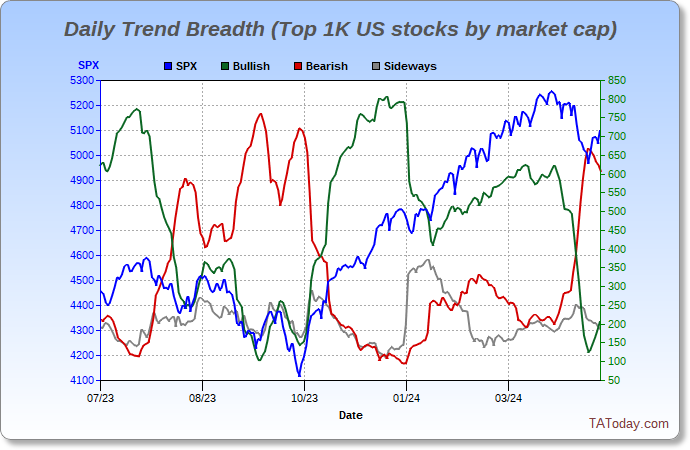
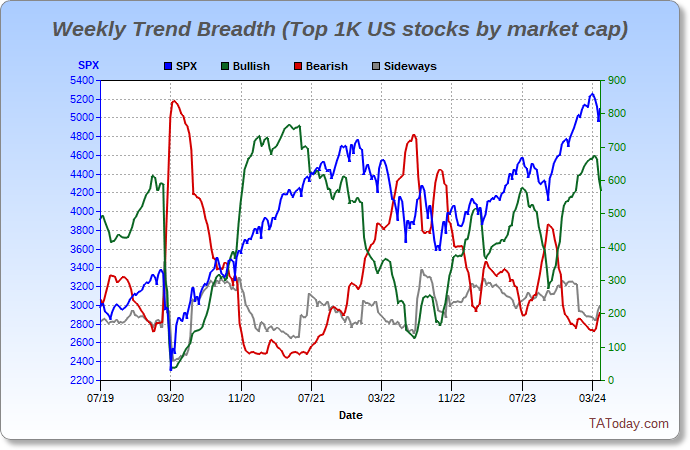
Most breadth measures are centered on advancing versus declining issues over some period of time. While useful, what is more useful is to know how many issues are bullish, bearish or sideways. This gives a measure of the trend breadth of a market.
The charts below are raw counts for daily and weekly trend breadth. Market cap weighted charts can be found here.
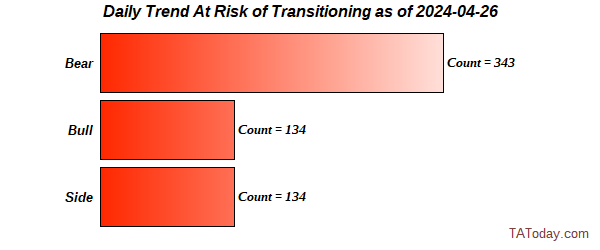
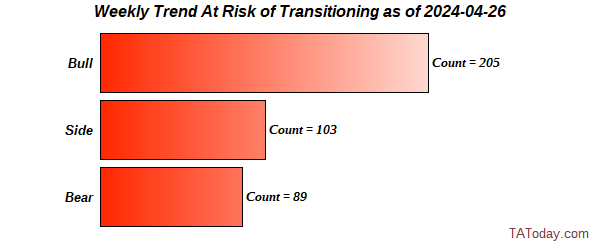
When viewed in context of price, one can get a sense of whether a move higher in price is supported by a move higher in bullishly trending stocks - or not. Same on bearishly trending stocks and declining prices. Additionally, we look forward with a "risk of transition" bar chart indicating the cumulative weight of stocks that are at risk of changing trend either up or down.
Last update = 2024-04-26